


October 2026 Market Recap
Data through the market close of Friday, October 30, 2026. Published by the Merited Wealth investment team.
CONTENTS
The short version · The one idea to take away
Where the returns came from · Bonds get a break · How the economy is holding up · Around the world · Commodities, gold and the dollar
Show me the money · Banks kick off earnings season · What companies are saying about the consumer · Also worth knowing
Iran, Saudi Arabia and the Strait of Hormuz · Russia and Ukraine · Trade · Elections around the world · Elsewhere
October at a Glance
On paper, October looked like a rerun of September. The S&P 500 slipped 0.9%, another small loss. Underneath, the month played out almost exactly in reverse. In September a handful of big technology companies carried the market while most stocks fell. In October those same companies stumbled, and nearly everything else went up. The average stock in the S&P 500 gained 5%, the Dow rose 1.7% and smaller companies in the Russell 2000 edged up 0.5%, while the tech-heavy Nasdaq fell 5.3%.
S&P 500 −0.9% Closed at 7,580. Up 10.7% for the year. | NASDAQ COMPOSITE −5.3% Closed at 25,437. Up 9.4% for the year. |
10-YEAR TREASURY YIELD 4.94% Down 35 basis points in October. Up 76 for the year. | GOLD −6.8% About $3,876 an ounce. Its lowest level in more than a year. |
The short version
Three forces explain almost everything that happened in October. The bill for building artificial intelligence came due, long-term interest rates finally came down, and oil kept climbing. Each one pushed on a different part of the market, and together they turned September’s leaders into October’s laggards.
Start with the bill. Earnings season showed that the largest technology companies are still growing quickly, but the data centers they are building for AI now eat up most of the cash their businesses bring in, and at some of them, more than all of it. Investors didn’t like the math. Alphabet had its worst day since it went public in 2004, Intel had its worst day since 1974, and chip stocks around the world sold off. Most of that money never left the stock market. It just changed seats. Energy, consumer staples, utilities and health care each gained about 10% or more, and nine of the 11 sectors in the S&P 500 finished the month higher.
Then there were rates. The 10-year Treasury yield hit 5.31% on October 5, its highest close since 2002, and then fell to 4.94% as investors sold tech stocks and bought government bonds. It did that even though inflation moved the wrong way. Consumer prices rose 3.7% from a year earlier in September, up from 3.4% in August, with gasoline doing much of the damage. The Fed left interest rates where they were on October 28.
The economy itself is still running hot. It grew at a 3.4% annual rate in the third quarter, faster than expected, and a survey of business activity stayed close to a five-year high. Hiring is the soft spot, with employers adding just 29,000 jobs in September. Households couldn’t agree on how they feel. The Conference Board’s confidence index bounced to its highest level since June as gas prices eased, while the University of Michigan’s sentiment survey stayed near its record low.
And then there’s oil, which climbed about 15%. The war with Iran, now more than eight months old, brought more attacks on tankers near the Strait of Hormuz and on targets inside Saudi Arabia, and Brent crude, the global benchmark, reached its highest close since April on October 23. Gold went the other way. The metal many people buy for protection fell 6.8% in a month full of things to be protected from, dropping below $4,000 an ounce for the first time since July as markets braced for another Fed hike. The dollar barely moved.
Overseas, Europe had its best month since June, helped by the same kinds of steady businesses that did well in the US, while Asia took the brunt of the AI sell-off. South Korea’s market, which is packed with memory-chip makers, fell 16%, and Japan and China each fell more than 5%. In Brazil, stocks dropped 13.9% in a single day after President Lula won reelection, a result many investors hadn’t positioned for.
Profits, for their part, look strong. With 60% of S&P 500 companies reporting, FactSet’s tally shows third-quarter earnings growth of about 30%, and 82% of companies have beaten analysts’ estimates. What changed in October was the question investors were asking. For two years it was how much a company could earn from AI. Now it’s how much the company has to spend to get there.
THE ONE IDEA TO TAKE AWAY
For the past few years, investors rewarded almost any company that spent heavily on artificial intelligence. October was the first month that really changed. Alphabet, Amazon and Meta all grew revenue by double digits, and their stocks still fell, because building AI now eats up more cash than some of these businesses bring in. Big Tech has been running the Field of Dreams playbook. Build a ballpark in the middle of an Iowa cornfield and trust that the crowd will come. The crowd is coming, with cloud revenue at Microsoft, Amazon and Google growing anywhere from 39% to more than 100%. What investors started asking in October is how long it takes to fill the stands, and how much the ballpark costs in the meantime. That question could take years to answer, and it can move markets a lot along the way. It’s also a good reminder of why owning more than one part of the market matters. In a month when the biggest tech names fell, the average stock in the S&P 500 quietly gained about 5%.
Markets and the Economy
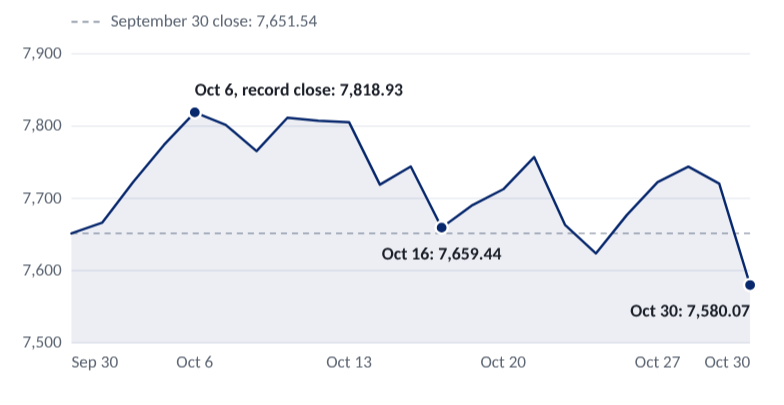
For the second month in a row, a small move in the S&P 500 hid a big shift underneath. In September the giants did all the work. In October they stumbled, and almost everything else rose.
Figure 1. S&P 500 daily closing levels in October
Source: S&P 500 daily closing levels, Associated Press market data. Price index, excludes dividends.
The month started well, thanks to some bad news. A weak September jobs report on October 2 eased fears of another Fed hike, and the index rose 2.2% in four trading days to a record close of 7,818.93 on October 6. It then drifted lower as chip stocks sold off, and on October 16 the Nasdaq finished its worst week since June. For the next two weeks the S&P 500 bounced between roughly 7,620 and 7,760 as earnings rolled in. The last day of the month did the most damage. On October 30, after disappointing outlooks from Amazon and Intel, the index fell 1.8%, its biggest drop of the month, and closed at its low for October.
Where the returns came from
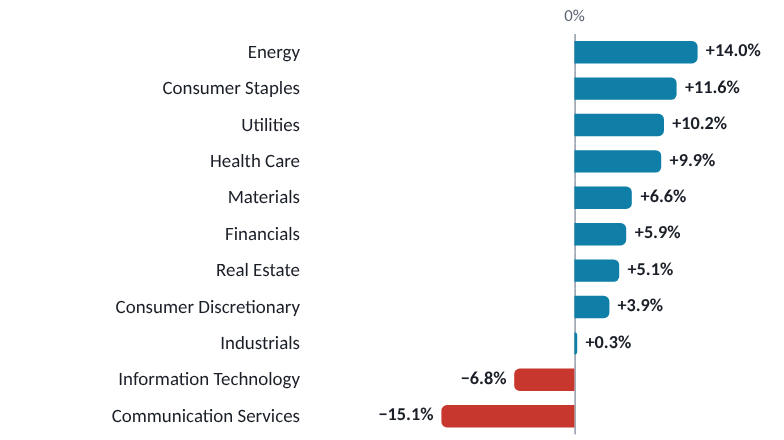
Figure 2. October returns by S&P 500 sector
Total return by GICS sector for October 2026. Source: S&P Dow Jones Indices, U.S. Equities Dashboard, October 30, 2026.
Nine of the 11 sectors rose. The two that fell were the same two that carried the market in September. Big Tech lived by the sword on the way up, and in October it learned the second half of that saying.
- Communication services fell 15.1%. Alphabet and Meta both slid after their earnings reports, and phone carriers T-Mobile, AT&T and Verizon dropped between 9% and 13% on October 9 after SpaceX moved to buy wireless spectrum for its own Starlink Mobile phone service.
- Technology fell 6.8%, dragged down by chipmakers. Intel lost nearly 29% on the last day of the month, and the Philadelphia Semiconductor Index fell 7.2% that day alone.
Everything else had a good month, and the winners were the steadier, less exciting parts of the market. Energy rose 14.0% as oil climbed and is now up 60% for the year. Consumer staples gained 11.6%, utilities 10.2% and health care 9.9%. Put simply, oil, toothpaste, electricity and prescriptions beat chips and search ads. Some of that was investors looking for shelter from the tech sell-off, and some of it was the drop in bond yields. In our September recap we noted that dividend-paying stocks look less special when a Treasury bond pays over 5%. The reverse is also true, and when yields fell in October, these sectors got a lift. Financials rose 5.9% after solid bank earnings, and real estate rose 5.1%.
WHY THE AVERAGE STOCK BEAT THE INDEX
The S&P 500 is weighted by company size, so it plays like a basketball team that runs almost every play through a handful of superstars. In September the stars got hot and nearly carried the team to a tie on their own. In October they went cold, and even though the rest of the roster shot well, it wasn’t quite enough to win. Including dividends, the S&P 500 lost 0.9%, while the S&P 500 Equal Weight Index, which holds the same 500 companies in equal amounts (think of it as everyone getting the same minutes), gained 5.0%. Growth stocks lost 5.4% and value stocks gained 4.9%, a gap of more than 10 percentage points in a single month.
Source: S&P Dow Jones Indices. Total returns for the S&P 500, S&P 500 Equal Weight, S&P 500 Growth and S&P 500 Value indexes, October 2026.
Bonds get a break
The 10-year Treasury yield made a round trip. It rose to 5.31% on October 5, its highest close since 2002, then fell for most of the month and finished at 4.94%. That’s a drop of 35 basis points, where a basis point is one-hundredth of a percentage point. The yield slipped back below 5% on October 22, the day chip stocks had their worst session since June and investors moved money into government bonds. The 2-year yield fell 32 basis points to 4.56%, and the 30-year dropped to 5.31%.
The odd part is that the inflation news was bad. Consumer and producer prices both came in hotter than expected. Hot inflation usually pushes yields up, not down. So why did they fall? Three reasons stand out.
- A flight to safety. Investors selling tech stocks parked the money in Treasuries while they waited for the dust to settle.
- Buyers showed up. Last month we asked whether long-term rates would find a ceiling. Large government bond auctions in the second week of October drew strong demand, a sign that big investors were happy to lock in yields near these levels.
- Hiring slowed. The weak September jobs report reminded everyone that higher rates are starting to bite, and a slower economy usually means lower rates down the road.
Inflation-adjusted yields fell too. The yield on 10-year Treasury Inflation-Protected Securities (TIPS), which shows what a Treasury bond pays after inflation, dropped from 2.93% to 2.60%. Mortgage rates followed, though slowly. Freddie Mac’s average 30-year fixed rate hit about 7.4% earlier in the month, its highest in nearly three years, then eased to 7.24% by October 29. On a $400,000, 30-year loan, that drop saves about $44 a month. It isn’t much, but it’s a start. Hang tight, homebuyers.
Corporate bonds told a different story. High-yield bonds, issued by companies with weaker credit, pay extra to make up for the risk, and that extra yield over Treasuries widened from 3.12 to 3.44 percentage points as worries about heavily indebted AI data-center builders spilled into credit markets. For savers, high-quality bonds still pay close to the most they have in about two decades, with the 10-year near 5% and the 30-year above 5.3%.
How the economy is holding up
| Indicator | Latest | What it says |
|---|---|---|
Consumer prices (CPI), September | +3.7% y/y | Up from 3.4%. Core inflation rose to 2.6%, and gasoline jumped 9.1% in the month |
PCE inflation, September | +3.6% y/y | The Fed’s preferred gauge, up from 3.4%. Core PCE rose to 3.1% from 3.0%. Released October 29 |
Producer prices, September | +6.3% y/y | Up from 5.4% and well above the 5.3% forecast |
Payroll employment, September | +29,000 | Well below forecasts. July and August were revised down a combined 60,000 |
Unemployment rate, September | 4.2% | Up from 4.1%. Average hourly pay rose 3.0% from a year earlier |
Retail sales, September | +0.8% | Helped by higher gas prices. Excluding gas stations, sales rose 0.2% |
GDP growth, Q3 (first estimate) | +3.4% | Faster than the 3.2% forecast and up from 2.2% in the second quarter |
Business activity (PMI), October | 57.6 | Down from 58.4 but still near a five-year high, per S&P Global’s flash survey. Prices charged rose at the fastest pace since 2022 |
Consumer confidence, October | 91.7 | Up from 84.2 and the highest since June. Expected inflation eased to 5.8% |
Consumer sentiment (University of Michigan), October | 48.0 | The second-lowest reading on record. Expected inflation over the next year rose to 4.7% |
Put the table together and three different stories come out of it. Businesses are busy. Growth came in at 3.4% in the third quarter, and the purchasing managers’ survey stayed near a five-year high. Prices are climbing, mostly because of energy. Gasoline jumped 9.1% in September alone and accounted for more than half of the rise in consumer prices. Producer prices, which track what businesses pay, rose 6.3% from a year earlier, and companies told S&P Global they were raising their own prices at the fastest pace since 2022. That matters for shoppers, because what businesses pay today has a way of showing up on store shelves later.
And households are tired. Hiring has slowed to a crawl, but layoffs haven’t picked up, and weekly jobless claims fell to their lowest level in three months. Companies are holding on to the workers they have. They just aren’t adding many new ones. The two big consumer surveys couldn’t even agree on how people feel. One rebounded as gas prices eased, while the other stayed near the bottom of its history. Either way, people are clearly feeling the pinch from higher prices and borrowing costs.
GOOD RESULTS WEREN’T ALWAYS ENOUGH
According to FactSet, 60% of S&P 500 companies had reported third-quarter results by October 30, and 82% of them beat analysts’ earnings estimates, above the five-year average of 78%. Blended earnings growth stands at 30.2% from a year ago, up from 29.1% at the end of September, and every sector is growing. One thing stood out, though. Companies are beating estimates by 1.9% on average, far less than the five-year average of 7.5%. When everyone expects a company to clear the bar by a mile, clearing it by an inch can look like a miss, and investors punished anyone whose outlook disappointed. The S&P 500’s forward price-to-earnings ratio slipped to 18.7, a bit below its ten-year average of 19.1.
Source: FactSet Earnings Insight, October 30, 2026.
Around the world
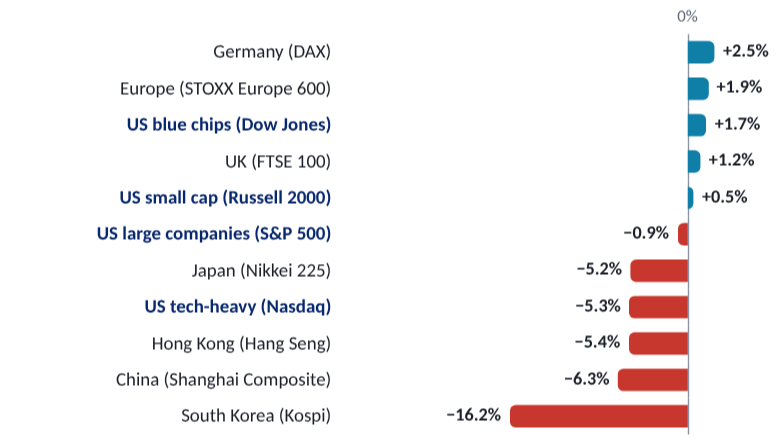
Figure 3. October returns across US and international markets
October 2026 price return, each index in its own local currency. Sources: Associated Press, Nikkei Inc., STOXX, FTSE Russell, Deutsche Börse, Hang Seng Indexes, the Shanghai Stock Exchange and the Korea Exchange. Bold type marks the US markets.
Last month we wrote that anyone looking for a live read on how investors feel about AI should watch South Korea. October made the point. The Kospi fell 16.2%, its seventh-worst month on record, and on October 15 a 7.6% drop set off trading halts on both of Korea’s main stock markets. The worry was that China’s CXMT is catching up in memory chips, on top of broader doubts about AI spending. The strange part is that the Korean chipmakers themselves are doing very well. Samsung said its third-quarter operating profit rose nearly ninefold, and SK Hynix’s profit rose more than sevenfold. Their stock prices had simply run ahead of even those numbers, a reminder that a great business and a great stock price aren’t always the same thing. The Kospi is still up about 36% for the year.
Japan’s Nikkei 225 briefly topped 70,000 early in the month, then fell more than 10% from that peak to finish down 5.2%. China had a rough month too. The Shanghai Composite fell 6.3%, and the CSI 300 index of large Chinese companies lost 8.5%, its biggest monthly drop in more than a decade. Hong Kong’s Hang Seng fell 5.4%.
Europe was the bright spot. The STOXX Europe 600 rose 1.9%, its best month since June, Germany’s DAX gained 2.5% and the UK’s FTSE 100 rose 1.2%. For years, the knock on Europe’s stock market has been that it has so few tech giants. In October that was the selling point. Europe has more banks, drugmakers, energy companies and consumer staples, which were exactly the kinds of businesses that did well.
Brazil had the most dramatic day of the month. Investors had bought Brazilian stocks expecting a win by challenger Flávio Bolsonaro, and when President Lula won the October 25 runoff instead, the main stock index fell 13.9% the next day, its biggest drop since March 2020. The Brazilian real had its steepest one-day fall against the dollar since 1999, the year Brazil first let its currency float freely. Markets that bet heavily on one outcome tend to pay for it when they get the other.
Back home, smaller companies held up far better than the tech giants. The Russell 2000 rose 0.5% and is now up 13.3% for the year, ahead of the Nasdaq’s 9.4%. A month ago it was the other way around.
Returns above are index price returns in each market’s own currency. The dollar barely moved in October, so currency swings had little effect on what a US investor in an international fund would have seen.
Commodities, gold and the dollar
| Market | Oct 30 level | October | 2026 to date |
|---|---|---|---|
Gold | $3,876/oz | −6.8% | −10.2% |
Crude oil (WTI) | $104.12/bbl | +15.2% | +81.3% |
US Dollar Index | 101.92 | +0.5% | +3.7% |
10-year Treasury yield | 4.94% | −35 bp | +76 bp |
Fed funds target | 3.75% to 4.00% | Unchanged | +25 bp |
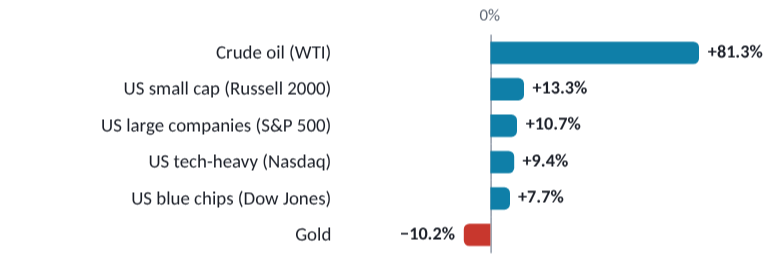
Oil rose again. US crude (WTI) climbed 15.2% to $104.12 a barrel and is up 81% for the year. Brent gained about 14% and closed at $116.72 on October 23, its highest since April, after a drone attack near one of Saudi Aramco’s biggest oil fields and reports that the US was planning new strikes on Iran after the midterm elections. Attacks on tankers around the Strait of Hormuz also picked up during the month. Two things kept prices from climbing even further. Aramco chief executive Amin Nasser said the company’s East-West pipeline, which carries crude across the country to the Red Sea and around Hormuz, is moving about 7 million barrels a day. That’s the same pipeline drones knocked offline in September, now running at full capacity. The US also eased sanctions on Russian diesel.
At the pump, the news was better than the oil price. Gas prices often ease in the fall as summer driving fades and stations switch to cheaper winter blends, and this year was no exception. AAA’s national average for regular gas slipped from $4.41 to $4.22 a gallon over the month, about $2.85 saved on a 15-gallon fill-up. That’s not a fortune, but drivers will take it.
Gold fell for a second straight month, losing 6.8% to about $3,876 an ounce. It dropped below $4,000 on October 23 for the first time since July and fell another 3.6% on October 30 alone. That last day was a head-scratcher. Stocks were selling off, which is exactly when a safe haven is supposed to shine, and investors looking for safety went to Treasuries and the Japanese yen instead. The bigger pressure came from expectations of another Fed hike. Gold pays no interest, so it has a hard time competing with Treasury yields close to 5%. It is now about 31% below its January record of roughly $5,590. For an asset many people buy for peace of mind, it hasn’t offered much of it this year.
The dollar barely moved, edging up about half a percent. Copper slipped about 1%, to roughly $6.50 a pound.
Figure 4. The year so far
Year-to-date price return, December 31, 2025 through October 30, 2026. Sources: Associated Press, NYMEX settlement prices (oil) and New York spot gold closes.
Companies in the News
Third-quarter earnings season hit full speed in October, and it was a month when a company could beat every estimate and still watch its stock fall. Most of the results were good. The reactions were another story.
Show me the money
The biggest tech companies reported in the last week of October, and all of them are spending enormous sums on data centers for artificial intelligence. Alphabet, Amazon and Meta alone expect to spend more than half a trillion dollars this year on capital projects, meaning the buildings, chips and power equipment that make AI run. For two years investors cheered that spending. This quarter they took a page from Jerry Maguire and asked to see the money, judging each company on a simple question. Is the spending paying off yet?
Microsoft passed the test. Revenue from its Azure cloud business grew about 48%, it spent less than analysts expected, and finance chief Amy Hood said “we still have demand that exceeds supply.” The stock rose about 4% after the report. Alphabet had a much harder night. Its Google Cloud business more than doubled, which on most days would be the headline, but overall revenue and earnings missed estimates for the first time in nearly four years, and free cash flow, the cash left over after paying for investments, was negative $9.1 billion. That number matters because free cash flow is what pays for dividends, buybacks and the next round of building. On October 29 the stock fell 12.6%, its worst day since going public in 2004, erasing roughly $500 billion of market value. That’s more than the entire value of most companies in the S&P 500, gone in a single session.
Amazon’s cloud business, AWS, grew 39%, but its free cash flow over the past year swung to negative $42.4 billion as it spends about $220 billion on capital projects this year. Meta’s revenue rose 26%, yet the stock fell 7% the day after its report as the company said it would spend $135 billion to $145 billion this year. A few days later, Meta announced plans to sell $35 billion of new stock to help pay for its AI build-out, with more planned for 2027. Separately, a New Mexico judge ordered Meta to pay $25 billion over misleading statements about privacy, a ruling the company plans to appeal.
The worry spread well beyond the giants. CoreWeave, which rents out AI computing power and has borrowed heavily to build it, saw both its stock and its bonds slide in mid-October. Intel fell 28.6% on October 30 after a weak forecast for the final quarter of the year. It was the company’s worst day since 1974, back when Intel was mainly a memory-chip maker. Software maker ServiceNow fell 27%, its worst day ever, on a slower outlook for new contracts, and Caterpillar dropped nearly 10% despite a record $78 billion order backlog, largely because it didn’t raise its guidance. When expectations are this high, good results aren’t always good enough.
There was good news for the AI trade too. On October 6, Constellation Energy signed a 20-year deal to supply Google with 3.6 gigawatts of nuclear power, and its stock jumped 12%. Contract manufacturer Celestica forecast $40 billion of revenue next year, nearly double this year’s, on demand for AI servers. And on October 26, Anthropic made its IPO filing public, showing $16.3 billion of revenue in the first half of 2026. Chip stocks rallied 2.8% that day.
There’s a history lesson worth keeping in mind. In the late 1990s, telecom companies borrowed heavily to lay fiber-optic cable for an internet boom that turned out to be very real. The traffic did show up, but years later than the spending assumed, and much of that cable sat unused, or “dark,” while many of the companies that laid it didn’t survive to see it lit. Today’s biggest spenders are far more profitable, and much of what they build is used as soon as it’s switched on. Still, a technology can change the world and still be a tough investment for the people paying to build it.
Banks kick off earnings season
The big banks reported in mid-October, and Wall Street had a strong quarter. Goldman Sachs earned $17.01 a share, about $4 more than analysts expected, on strong trading and dealmaking. Morgan Stanley’s stock-trading revenue jumped 41%, and its wealth management business posted record revenue. JPMorgan’s profit missed estimates, partly because of losses on securities sales, and management described the slowdown in dealmaking at the end of September as “delayed rather than canceled.” Credit quality looked fine. The share of credit card balances written off as unpaid fell at both Wells Fargo and Citigroup.
Some banks are also taking a hit now to earn more later. Truist booked a $1.45 billion loss selling older, low-yielding bonds, and First Horizon agreed to sell about $4.5 billion of low-rate mortgages. Both plan to reinvest the money at today’s higher rates. It’s a bit like trading in a car that still runs but gets terrible gas mileage. The trade-in value stings, but every month after that, the savings at the pump add up.
What companies are saying about the consumer
In our September recap we said we’d be listening for what companies had to say about the consumer. The answer was the same split we described then. People with money are spending it, especially on travel. Delta said revenue from premium seats grew 18%, even as a roughly $6 billion jump in fuel costs this year squeezed its profit. Everyday spending looks weaker. PepsiCo’s North American snack and drink sales stalled and it trimmed its profit outlook. Nike now expects sales to fall this fiscal year, with China down 22% last quarter. Whirlpool swung to a loss and skipped its quarterly dividend as demand for big-ticket appliances slowed. General Motors beat estimates and announced a $20 billion buyback, but its stock still fell 6.8% because its full-year outlook came in a little light, and Netflix cut its advertising revenue target for the year. In other words, the front of the plane is full and the snack aisle is quiet.
Tariff refunds are still showing up in the numbers. Hasbro’s stock jumped 11% on strong results that included about $55 million of refunds on tariffs the Supreme Court struck down earlier this year. As we said last month, these work like a tax refund. It’s nice money to get, but nobody should count on it again next year.
Also worth knowing
- SpaceX now makes more from AI than from Starlink. The rocket company’s biggest business is now renting out computing power. In its third-quarter report, revenue from selling AI computing capacity reached $7.56 billion, more than its satellite-internet business, and total revenue rose 161% to $14.6 billion. Elon Musk also said SpaceX and Tesla have each formed committees to discuss a possible merger, with no terms agreed.
- Accenture jumped 21% on October 1 after its quarterly revenue topped its own forecast, easing fears that AI would eat into demand for consulting.
- Boeing fell about 10% on October 27 after pushing back its goal of building 47 of its 737 jets a month to early 2027 and delaying its cash-flow recovery by a year.
The World Beyond Markets
Energy and trade have become the main tools of foreign policy, and October was full of examples. Iran is using the Strait of Hormuz as leverage. Washington eased sanctions on Russian diesel to keep fuel prices in check, even as it pushes for peace talks. Europe and China bargained over how many Chinese cars can be sold in Europe. It’s a chess match where the pieces are oil barrels, pipelines and tariffs, and oil was again the main way all of this reached the markets. Elections on several continents also made news, and one of them moved a market by double digits.
Iran, Saudi Arabia and the Strait of Hormuz
The war that began on February 28 is now more than eight months old, and the Pentagon puts its cost to the US at $47.1 billion so far. Iran says the Strait of Hormuz stays closed to ships that don’t follow its rules, and it has laid mines along routes it calls unauthorized. Tankers caught fire after hitting mines on several days in October, and Iran’s Revolutionary Guard claimed attacks on other ships. The US Navy continues to blockade Iranian ports.
The fighting reached further into Saudi Arabia. On October 10, an attack claimed by Yemen’s Iran-backed Houthi forces hit Riyadh’s main airport, killing at least 12 people and wounding more than 300, and the airport stayed closed for a week. On October 21, Saudi forces shot down a drone headed for Aramco’s Shaybah oil field, and the debris killed two people, though oil output wasn’t affected. Late in the month, the US ordered non-emergency diplomatic staff to leave Saudi Arabia.
Diplomacy kept going in the background, stuck on a chicken-and-egg problem. Iran says it could reopen Hormuz within days if the US lifts its blockade first, while Washington wants Iran’s nuclear program dealt with first. Saudi, Turkish and Pakistani officials held security talks in Tehran on October 26, and Qatar continues to mediate. At the same time, the Wall Street Journal reported that the US had told Gulf allies to prepare for a short, intense military campaign against Iran after the November 3 midterm elections. The White House declined to comment on the report.
Russia and Ukraine
Energy was at the center of this war too. On October 11, President Trump announced an “energy ceasefire” under which Russia and Ukraine would stop hitting each other’s power and fuel facilities, though Ukraine said Russian strikes continued. Washington also arranged for Russian diesel to be sold into the US to help with fuel prices, and on October 16 the president waived most of the new Russia sanctions and tariffs he had signed into law in September, days before they were due to take effect. Senators from both parties criticized the move.
Ukraine paused its drone strikes on Russian oil refineries this month under pressure from US officials, according to the Wall Street Journal. A sudden slowdown of Starlink service in mid-October disrupted the drones Ukraine uses to shoot down Russian drones and turned into a dispute over who ordered it. President Zelenskyy says he expects talks among the US, Russia and Ukraine in Abu Dhabi between November 6 and 10, though Moscow says the battlefield will decide when talks begin. The market angle is diesel. Every barrel of Russian fuel that reaches the market helps ease prices that have been squeezing truckers, farmers and airlines.
Trade
Europe and China reached a preliminary deal to cap Chinese exports of hybrid cars to Europe at 350,000 a year, less than half of what China was on pace to ship. Chinese carmakers had shifted to hybrids after the EU put steep tariffs on fully electric Chinese cars in 2024, so Europe is now closing the side door after closing the front one. China, for its part, announced export controls on tunnel-boring machines starting November 18 and proposed limits on exports of solar manufacturing technology. Closer to home, the White House reshuffled its list of Canadian goods facing 50% tariffs, and a senior economic adviser said a trade deal with Canada is “very close.” The US and China’s trade truce, extended in September, now runs through January 10.
Elections around the world
- Brazil. President Luiz Inácio Lula da Silva won a fourth term on October 25 with 51.8% of the vote against Flávio Bolsonaro, son of the former president. Bolsonaro said he would seek to annul the result, though analysts see that as a long shot given the margin.
- Israel. Prime Minister Benjamin Netanyahu’s bloc won 53 of the Knesset’s 120 seats on October 27, short of a majority, and the opposition can’t reach 61 without Arab parties that its leaders have pledged not to rely on. Netanyahu stays on as caretaker while coalition talks go on.
- Serbia. A student-led protest movement won a snap parliamentary election on October 25, and Aleksandar Vučić, who has dominated Serbian politics for more than a decade, conceded defeat.
- Canada. Alberta voters rejected a second, binding referendum on leaving Canada by about three to one on October 19. Earlier in the month, the separatist Parti Québécois won Quebec’s provincial election, putting the question of another independence vote back on the table there.
Elsewhere
- Ebola. The outbreak in the Democratic Republic of Congo has passed 10,000 cases and nearly 5,000 deaths, making it the second-largest Ebola outbreak on record. It has now reached Kenya, which has nine cases, and Nigeria, which confirmed its first case in a traveler from Uganda. There is no approved vaccine for this strain, though trials have begun. We don’t see a meaningful market impact, but cross-border spread is the thing to watch, and the human toll deserves more attention than it is getting.
- Cost-of-living protests in Europe. A student protest in France grew into nationwide demonstrations over living costs and public services, with more than 2,000 arrests on October 17, and unrest spread to Italy, where truckers angry about diesel prices blocked roads. France’s borrowing costs climbed alongside, and its 10-year bond yield closed above 5% for the first time in more than 24 years.
Prepared by the Merited Wealth investment team. Data as of the market close on October 30, 2026, unless otherwise noted. Sources include the Associated Press, Reuters, Bloomberg, The Wall Street Journal, The New York Times, S&P Dow Jones Indices, FTSE Russell, Nasdaq, STOXX, Deutsche Börse, Nikkei Inc., the Korea Exchange, Hang Seng Indexes, the Shanghai Stock Exchange, B3, NYMEX, ICE Data Indices, the U.S. Department of the Treasury, the Bureau of Labor Statistics, the Bureau of Economic Analysis, the Federal Reserve, the Conference Board, the University of Michigan, S&P Global, FactSet, Freddie Mac, AAA and company filings.
Important Disclosures
About Merited Wealth. Merited Wealth is a registered investment adviser. Registration does not imply a certain level of skill or training. This publication is distributed to clients, prospective clients and other readers, and is posted on the firm’s website. Receiving, reading or forwarding it does not create an advisory, fiduciary or client relationship with Merited Wealth. An advisory relationship is established only through a written agreement with the firm.
Not individualized advice. This material is for informational and educational purposes only. It is not investment, tax, legal or accounting advice, and it does not consider the investment objectives, financial situation or needs of any particular person. It is not an offer to sell, or a solicitation of an offer to buy, any security or investment product, and it is not a recommendation to adopt any investment strategy. Readers should consult a qualified investment, tax or legal professional before making any decision based on this material.
Opinions and forward-looking statements. The views expressed are those of the Merited Wealth investment team as of the date of publication and may change without notice. Merited Wealth has no obligation to update this material. Statements about the economy, interest rates, markets, companies or future events are opinions or estimates, not guarantees, and actual results may differ materially. Analyst estimates and market-implied probabilities cited here are third-party views, not forecasts made by Merited Wealth.
Sources. Information in this publication comes from third-party sources believed to be reliable, including those listed above. Merited Wealth has not independently verified all of this information and does not guarantee its accuracy, completeness or timeliness.
Performance and index information. Past performance does not guarantee or indicate future results. Index returns are price returns unless noted and do not include dividends. Sector returns in Figure 2 and the equal-weight, growth and value comparisons are total returns as published by S&P Dow Jones Indices. International index returns are shown in local currency and do not reflect currency movements. Bond, mortgage-rate and high-yield figures are approximate. Indexes are unmanaged, do not reflect fees, expenses or taxes, and cannot be invested in directly. Returns shown do not represent the performance of any Merited Wealth account, model or strategy.
Risks. All investing involves risk, including the possible loss of principal. Diversification and asset allocation do not ensure a profit or protect against loss in declining markets. Bond prices generally fall when interest rates rise, and bonds are subject to credit, inflation and liquidity risk. High-yield bonds carry greater credit and default risk. Stocks of smaller companies can be more volatile than stocks of larger companies. International and emerging-market investments involve additional risks, including currency movements and economic and political instability. Commodity prices, including oil and gold, can be highly volatile. Investments concentrated in a single sector or theme, such as technology or artificial intelligence, may be more volatile than broadly diversified investments.
Specific securities. Companies, securities and sectors mentioned are included to describe market events. They are not recommendations to buy, sell or hold any security, and it should not be assumed that any investment in them was or will be profitable. This is not a complete list of securities discussed or held. Merited Wealth, its employees and its clients may hold positions in securities mentioned, and those positions may change at any time without notice.
No testimonials or endorsements. This material contains no testimonials or endorsements. No compensation was paid to or received from any third party in connection with its preparation or distribution. Company, index and publication names are the property of their respective owners, and their use does not imply any affiliation with, or endorsement of, Merited Wealth.
Jurisdiction and Form ADV. Merited Wealth provides advisory services only in jurisdictions where it is registered or exempt from registration. This material is not intended for distribution in any jurisdiction where its distribution would be unlawful. More information about Merited Wealth, including its services, fees and conflicts of interest, is available in the firm’s Form ADV Part 2A, which is available on request and at adviserinfo.sec.gov.
Index definitions. The S&P 500 is a market-capitalization-weighted index of 500 large US companies. The S&P 500 Equal Weight Index holds the same companies, each at an equal weight at every rebalancing. The S&P 500 Growth and S&P 500 Value indexes divide the S&P 500 by growth and value characteristics. The Dow Jones Industrial Average is a price-weighted index of 30 large US companies. The Nasdaq Composite is a market-value-weighted index of common stocks listed on the Nasdaq exchange. The Russell 2000 measures the performance of 2,000 smaller US companies. The PHLX Semiconductor Index tracks 30 of the largest US-listed semiconductor companies. The STOXX Europe 600 covers large, mid and small companies across 17 European countries. The FTSE 100 comprises the 100 largest companies listed in London. The DAX tracks 40 major German companies. The Nikkei 225 is a price-weighted index of 225 companies listed on the Tokyo Stock Exchange. The Shanghai Composite tracks all stocks listed on the Shanghai Stock Exchange. The CSI 300 tracks 300 large companies listed in Shanghai and Shenzhen. The Hang Seng tracks the largest companies listed in Hong Kong. The Kospi tracks common stocks listed on the Korea Exchange. The Ibovespa tracks the most actively traded stocks on Brazil’s B3 exchange. The ICE BofA US High Yield Index tracks US dollar-denominated corporate debt rated below investment grade. The US Dollar Index measures the dollar against a basket of six major currencies. Treasury Inflation-Protected Securities (TIPS) are Treasury bonds whose principal adjusts with consumer prices, and their yield reflects the return after inflation.
Merited Wealth · 1666 79th Street Causeway, Suite 501, North Bay Village, FL 33141 · 12651 South Dixie Highway, Suite 321, Pinecrest, FL 33156 · www.meritedwealth.com · (305) 722-0091. © 2026 Merited Wealth. All rights reserved.